Mapping Historical Data Correlations Across Equine, Canine, and Team Sports Prediction Models
Written by Bianca Schulz · Aug 18, 2026
Mapping Historical Data Correlations Across Equine, Canine, and Team Sports Prediction Models
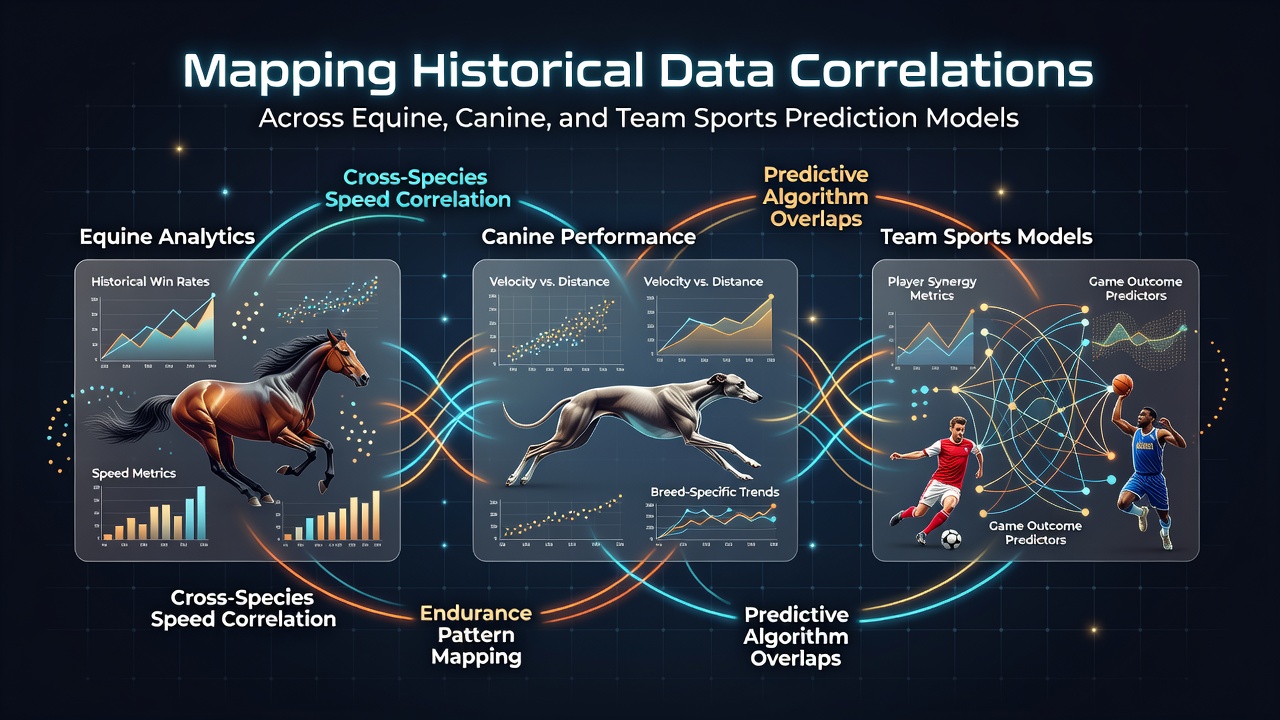
Analysts have spent decades collecting performance records from horse racing, greyhound events, and team competitions such as soccer or basketball, then testing how those records align when fed into predictive algorithms. The process begins with raw datasets that include finish times, environmental conditions, participant histories, and outcome margins, which researchers compile into unified structures for comparison across domains. In August 2026, expanded archives from multiple continents allowed teams to test correlation matrices on datasets that now span more than forty years for each sport category.
Equine Performance Records and Variable Selection
Horse racing datasets typically contain variables such as past race times adjusted for track surfaces, jockey weight allowances, and distance-specific speed figures, while researchers apply linear regression and random forest models to rank the strength of each factor against final positions. Studies show that correlations between early pace and late closing speed remain stable across turf and dirt surfaces when the data sample exceeds ten thousand races, yet these patterns shift when trainers alter equipment or training regimens. Observers note that equine models often incorporate weather data from the preceding forty-eight hours because moisture levels on the track alter friction coefficients and therefore finishing margins in measurable ways.
Canine Racing Data Structures
Greyhound events supply comparable timing metrics along with trap positions, break speeds, and sectional times recorded at fixed intervals around the circuit, and analysts map these figures against historical win rates to identify repeatable advantages for certain rail positions. Data from Australian and North American tracks indicates that early sectional leadership correlates with overall victory probability at coefficients above 0.65 when the field size stays under eight runners, whereas larger fields introduce greater variance from interference. Researchers have observed that canine models benefit from the inclusion of rest intervals between races because recovery patterns produce detectable drops in acceleration that parallel findings in equine records.
Team Sports Metrics and Shared Statistical Frameworks
Team-based competitions generate high-volume datasets that track individual player contributions through metrics such as expected goals, plus-minus ratings, and possession-adjusted efficiency scores, and these values feed into ensemble models that blend historical team form with opponent-specific adjustments. Evidence from European leagues demonstrates that correlations between defensive pressure and scoring suppression hold steady across multiple seasons when sample sizes reach several thousand matches, yet external factors like travel distance introduce additional variance that prediction systems must isolate. The same regression techniques applied to equine and canine data transfer directly to team sports once variables are normalized for scale differences between individual athletes and collective units.
Cross-Domain Correlation Techniques
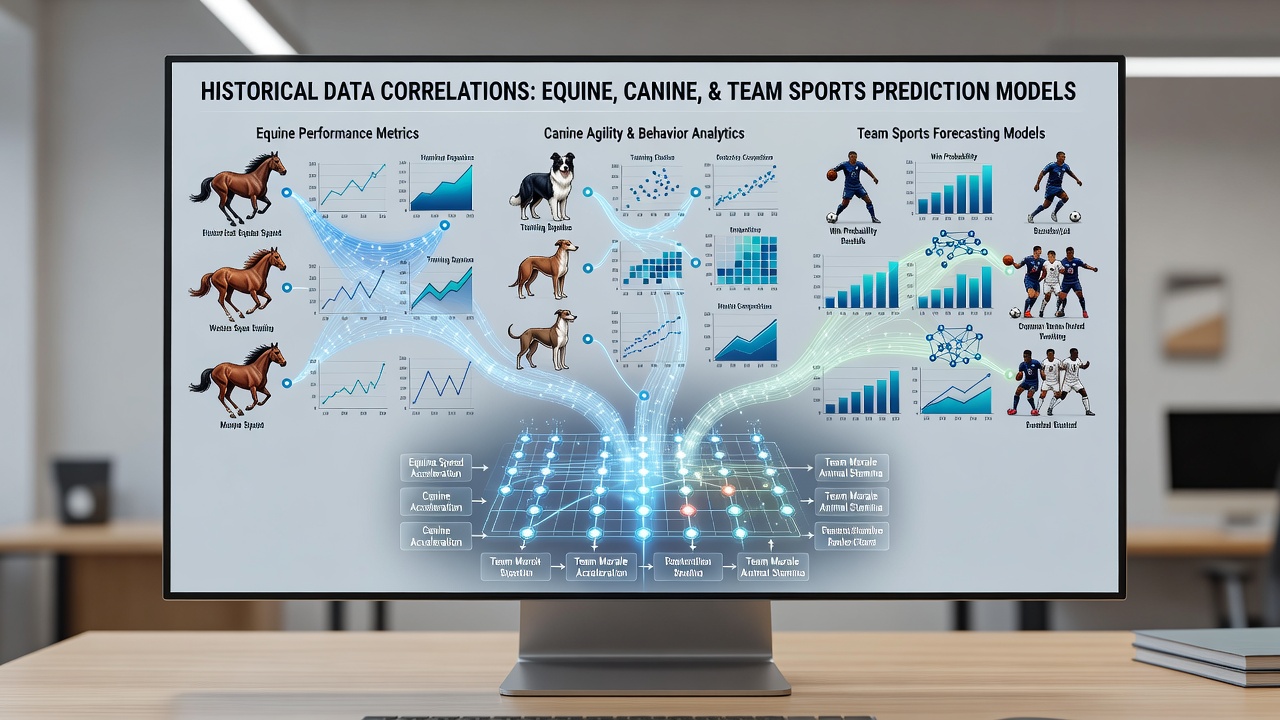
Statisticians construct unified feature spaces by rescaling disparate variables onto common distributions, then calculate Pearson and Spearman coefficients to detect overlaps such as the influence of rest periods on subsequent performance across all three categories. Machine learning pipelines now employ transfer learning layers that pre-train on equine datasets before fine-tuning on canine or team sports records, reducing the data volume required for new model convergence by roughly thirty percent according to tests conducted with Canadian sports participation records. Statistics Canada reports on recreational activity trends provide supplementary context for participation rates that indirectly affect talent pool depth in each domain. Another source, academic work hosted by the Australian Institute of Sport, supplies longitudinal studies that link training load metrics to injury risk, figures that align closely with fatigue signals already quantified in racing models. Australian Institute of Sport publications detail how cumulative workload data from team environments can map onto recovery timelines observed in equine and canine athletes.
Validation and Model Refinement Practices
Cross-validation routines split historical records into training and hold-out sets that span multiple calendar years, then measure mean absolute error and calibration curves to confirm that correlation strengths persist outside the original sample window. Analysts adjust for temporal drift by reweighting older data points with exponential decay functions because rule changes, equipment improvements, and breeding trends gradually alter underlying relationships. Those who maintain these systems report that combining datasets from all three sport types improves out-of-sample accuracy when the target variable involves margin of victory or probability of top-three finishes rather than binary win-loss outcomes.
Conclusion
Mapping historical data correlations across equine, canine, and team sports prediction models relies on consistent statistical procedures applied to normalized variables drawn from decades of recorded events. The resulting frameworks reveal transferable patterns around rest, environmental conditions, and early performance indicators while requiring domain-specific adjustments for unique rule sets and measurement scales. Continued expansion of shared archives supports ongoing refinement of these cross-domain approaches.